Portfolio Details
Buizenfestival 2023 Power BI Dashboard
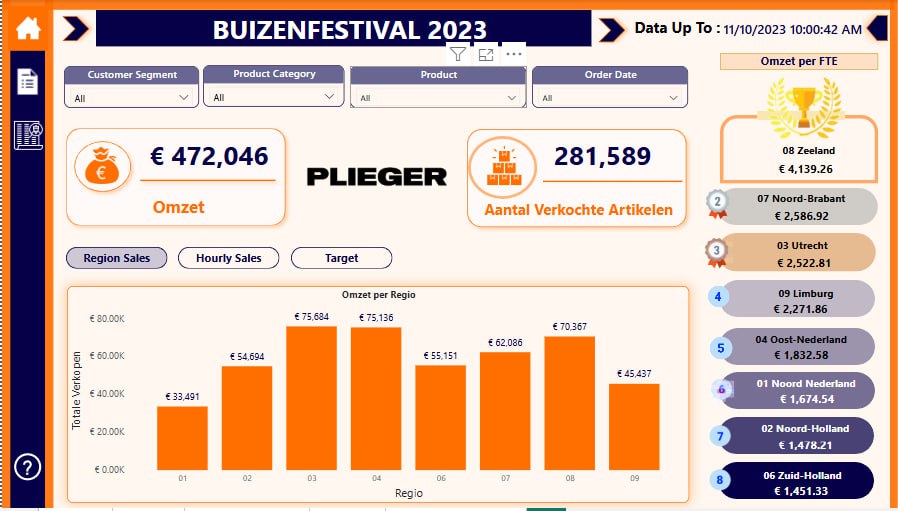
This Power BI dashboard provides a comprehensive sales performance analysis for Buizenfestival 2023, offering insights into key metrics, regional trends, and efficiency per full-time employee (FTE).
Key Features & Insights:
- Total Sales Performance: Displays key metrics such as total revenue (Omzet) and the total number of articles sold (Aantal Verkochte Artikelen).
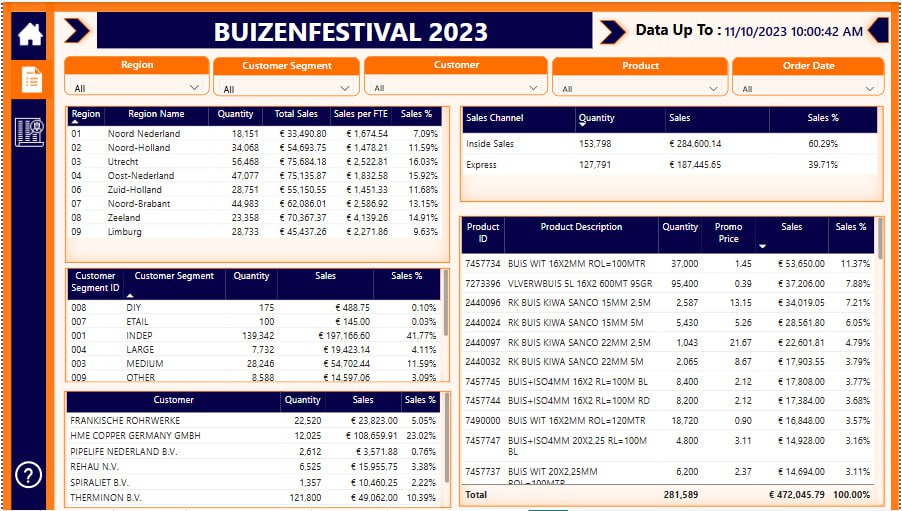
- Regional Sales Analysis: A bar chart visualizes revenue distribution across different regions, helping to identify top-performing and low-performing areas.
- Omzet per FTE (Revenue per Full-Time Employee): A ranked list on the right highlights the revenue contribution per FTE for each region, aiding in workforce efficiency evaluation.
- Dynamic Filters: Users can filter data by customer segment, product category, product, and order date to explore specific insights.
- Navigation Tabs: The dashboard includes sections for Region Sales, Hourly Sales, and Targets, allowing users to analyze different aspects of sales performance.
- Last Updated Timestamp: Ensures real-time or latest available data is displayed for accurate decision-making.
This dashboard is designed to help businesses track sales trends, compare regional performance, and optimize sales strategies effectively.